


When analyzing data, we often calculate the mean (average) to summarize information. But here’s a critical question: How reliable is that mean?
That’s where the Standard Error of the Mean (SEM) comes in. SEM measures how much the sample mean is expected to vary from the true population mean. In simple words, it tells us how precise our sample mean really is.
This article will walk you through what SEM is, how it’s calculated, why it’s important, and some real-world examples.
What is the Standard Error of the Mean?
The Standard Error of the Mean (SEM) is the standard deviation of the sampling distribution of the sample mean.
- If we take many random samples from a population, each sample will have its own mean.
- These sample means will not all be identical; they’ll vary around the population mean.
- SEM describes the spread of these sample means.
In short: SEM tells us how much the sample mean is likely to differ from the true population mean.
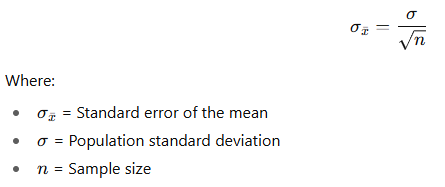
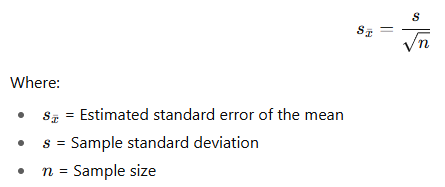
The Formula for Standard Error of the Mean
There are two cases:
1. When the population standard deviation (σ) is known:
2. When the population standard deviation is unknown (most real-life cases):
We use the sample standard deviation (s) instead:
Why is SEM Important?
- Precision of the Sample Mean
- Smaller SEM means our sample mean is closer to the population mean.
- Larger SEM means more uncertainty in our estimate.
- Confidence Intervals
- SEM is used to build confidence intervals around the mean. For example, a 95% confidence interval tells us the range in which the true population mean is likely to fall.
- Hypothesis Testing
- SEM helps test whether differences between sample means are statistically significant.
Examples of SEM Calculation
Example 1: Small Sample (n = 30)
Suppose we analyze 30 monthly returns of a stock.
- Sample mean = 2%
- Sample standard deviation (s) = 20%
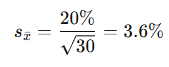
Interpretation: The mean monthly return is 2%, but if we repeated this process with many samples of 30 months, those sample means would vary with a standard error of 3.6%.
Example 2: Larger Sample (n = 200)
Now, take 200 monthly returns of the same stock.
- Sample mean = 2%
- Sample standard deviation (s) = 20%
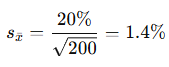
Interpretation: With more data, our estimate is more precise. The SEM drops from 3.6% to 1.4%.
Key Insights from SEM
- Bigger sample size → smaller SEM → higher accuracy.
- SEM is not the same as standard deviation:
- Standard deviation = spread of individual data points.
- SEM = spread of sample means.
- SEM gets closer to zero as the sample size gets very large (since the sample mean converges to the population mean).
SEM vs Standard Deviation
| Feature | Standard Deviation (SD) | Standard Error of Mean (SEM) |
|---|---|---|
| What it measures | Spread of raw data values | Spread of sample means |
| Formula | Based on population/sample data | SD ÷ √n |
| Affected by sample size? | No | Yes (gets smaller with bigger n) |
| Usage | Describes variability in data | Describes accuracy of the mean |
Final Thoughts
The Standard Error of the Mean (SEM) is a cornerstone of statistics. It shows how close our sample mean is likely to be to the true population mean.
- If your SEM is small, you can trust your sample mean more.
- If your SEM is large, you need either a bigger sample size or to be cautious about concluding.
In practice:
- Use SEM to understand precision.
- Use it in confidence intervals and hypothesis testing.
- Always remember: larger samples = smaller SEM = more reliable estimates.


