

Simple linear regression is one of the most widely used statistical techniques in data analysis, finance, economics, and machine learning. It helps us understand the relationship between two variables — one independent (predictor) and one dependent (outcome).
In this article, we will explain:
- What simple linear regression is.
- Key terms (dependent vs. independent variables).
- The regression equation.
- How coefficients (slope and intercept) are calculated.
- A detailed example with financial data.
By the end, you will have a clear understanding of how to apply regression and interpret its results.
What is Simple Linear Regression?
Simple linear regression is a statistical method that explains how one variable (the dependent variable, Y) changes in relation to another variable (the independent variable, X).
In short:
- Dependent variable (Y): The variable we want to predict or explain.
- Independent variable (X): The variable we use to make predictions.
Example: If we want to predict stock returns (Y) using GDP growth (X), stock returns are the dependent variable, and GDP growth is the independent variable.
Regression Equation
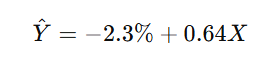
The general form of the simple linear regression model is:

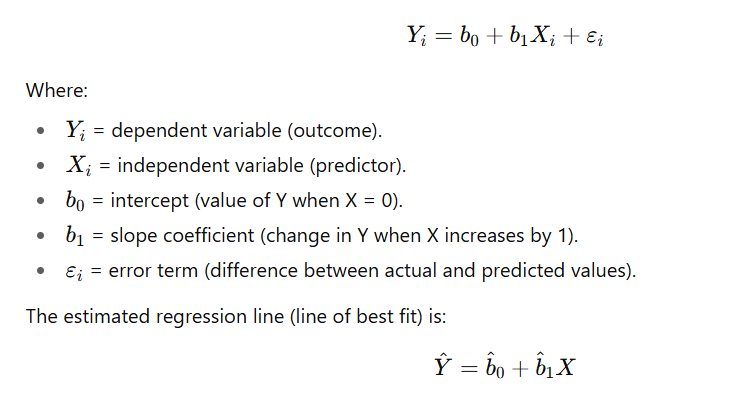
How is the Best Fit Line Found? (Ordinary Least Squares)
The regression line is chosen using the Ordinary Least Squares (OLS) method. OLS finds the line that minimizes the sum of squared errors (SSE):

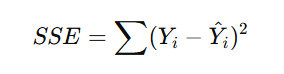
This ensures the line fits the data as closely as possible.
Interpreting Regression Coefficients
Intercept (b^0)
- Predicted value of Y when X = 0.
- Example: If b^0 = −2.3% when market return = 0, ABC stock’s expected return is –2.3%.
Slope (b^1)
- Expected change in Y for a one-unit change in X.
- Example: If b^1 = 0.64, then for every 1% change in market return, ABC’s stock return changes by 0.64%.
Financial Example: Stock Returns and Market Returns
Suppose we want to analyze how the S&P 500 excess return (X) explains the excess return of ABC stock (Y).
Given Data
- Cov(S&P, ABC) = 0.000336
- Var(S&P) = 0.000522
- Mean return, S&P = –2.70%
- Mean return, ABC = –4.05%
Step 1: Calculate Slope (b^1)

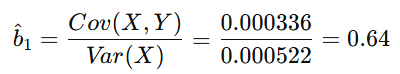
Interpretation: For every 1% change in S&P 500 excess return, ABC’s excess return changes by 0.64%.
Step 2: Calculate Intercept (b^0)

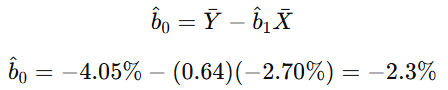
Interpretation: If S&P 500 excess return = 0, ABC’s expected return is –2.3%.
Step 3: Regression Equation

Step 4: Prediction Example
If in May 20X4, S&P 500 excess return = –7.8%:

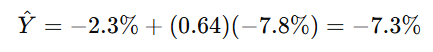
- Predicted ABC return = –7.3%.
- Actual ABC return = +1.1%.
- Residual (error) = +8.4%.
Visual Understanding

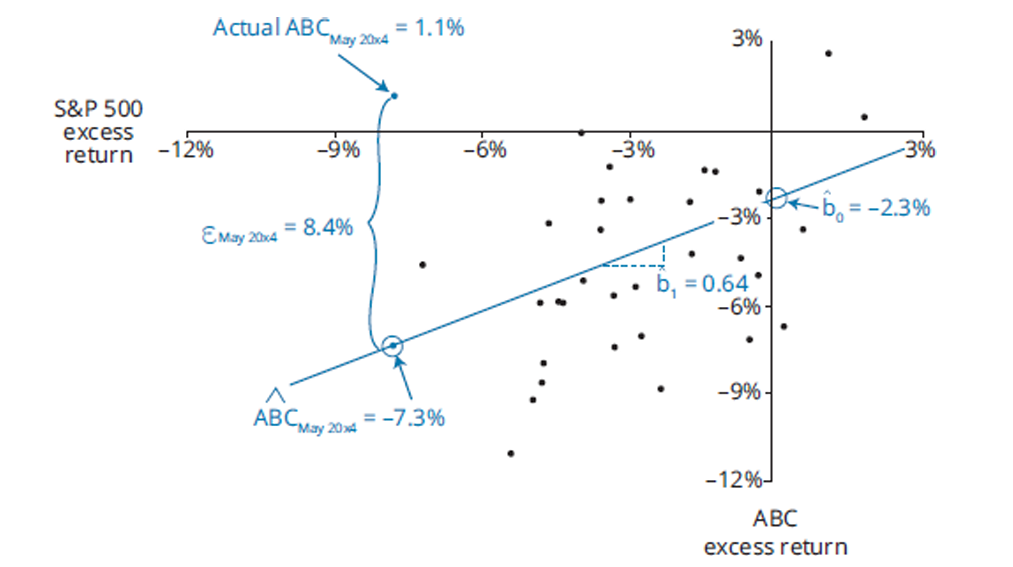
- The regression line shows the average relationship between ABC and S&P 500 returns.
- Most dots (actual data) lie close to the line, but some are far (large errors).
- The slope (0.64) = beta of ABC stock → it is less risky than the market (beta < 1).
Key Takeaways
- Positive slope = positive relationship → when the market goes up, ABC goes up (but less strongly).
- Intercept = baseline return → ABC underperforms by –2.3% when market return = 0.
- Beta = 0.64 → ABC stock has lower systematic risk compared to the market.
- Regression is a powerful tool, but not perfect — actual returns may differ (residuals).
Conclusion
Simple linear regression is a powerful statistical tool to understand relationships between two variables. By estimating a line of best fit, we can predict outcomes, measure sensitivity, and interpret risk.
In finance, regression is often used to calculate a stock’s beta, helping investors understand how risky a stock is compared to the market. In our example, ABC stock with a beta of 0.64 is less volatile than the market and moves in the same direction as the S&P 500, but with smaller fluctuations.