


Want a clear, visual way to turn uncertainty into numbers you can actually use? Enter the probability tree—a framework that lays out possible paths the world can take, the chances of each path, and what those paths mean for a company’s results or a portfolio’s return. In investing, probability trees help you formulate the problem, assign probabilities, and calculate expected values (like expected EPS or expected return). They also make it easy to update your view when new information arrives—this is where conditional expectations shine.
Below, we’ll define probability trees, build one step-by-step for an earnings problem, compute the expected EPS, and show how to revise expectations when conditions change. We’ll use the exact numerical digits from the example so you can follow along precisely.
What is a Probability Tree?
A probability tree is a branching diagram that:
- Lists events (e.g., “good economy” vs. “poor economy”),
- Shows the probability of each branch,
- And attaches outcomes (e.g., EPS or returns) to the endpoints.
To find the probability of an endpoint (a complete path), you multiply the probabilities along the path. To find an expected value, you weight each outcome by its path probability and sum them up. The probabilities of all endpoints must sum to 1.
Formulating an Investment Problem as a Probability Tree
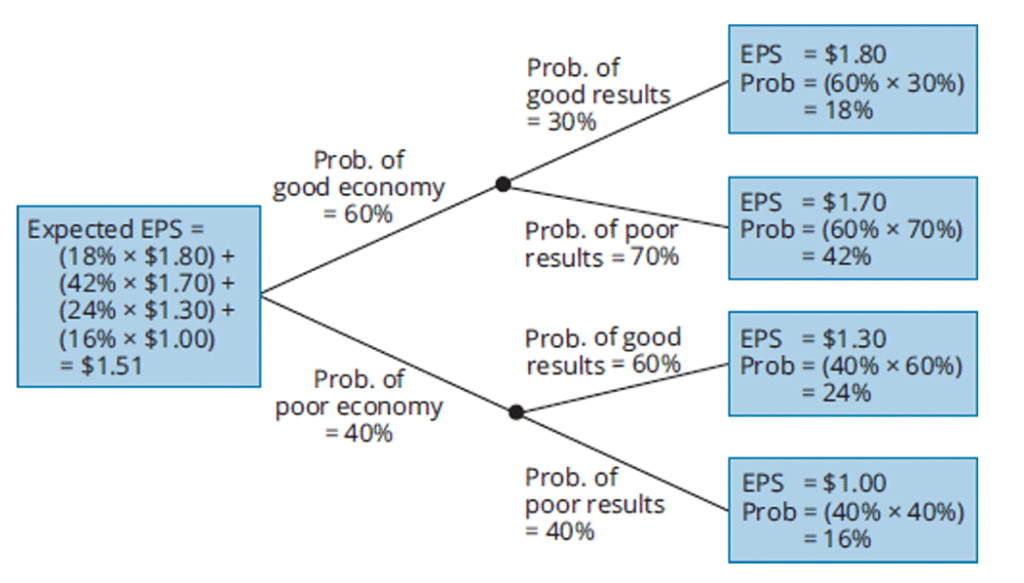
We start by thinking about the broader economy. Suppose there’s a 60% chance the economy will be strong and a 40% chance it will be weak. Once we establish this first split, we then condition on how the company itself might perform under each scenario. If the economy is strong, the company has a 30% chance of reporting very good results and a 70% chance of reporting weaker results despite the healthy environment. On the other hand, if the economy is weak, the company still has a 60% chance of delivering relatively good results, perhaps due to resilience or cost management, and a 40% chance of delivering poor results.
Now, to each of these “final destinations” on the tree, we attach an earnings-per-share (EPS) outcome. A strong economy combined with strong company results yields an EPS of $1.80. A strong economy but poor company results lead to $1.70. If the economy is weak but the company manages to do well, EPS is $1.30, while a weak economy and poor company performance together drag EPS down to $1.00.
By multiplying probabilities along the branches, we can calculate the likelihood of each outcome. For example, the probability of a strong economy and strong company results is 60% × 30%, or 18%. A strong economy with poor results is 60% × 70%, or 42%. A weak economy with good results is 40% × 60%, or 24%, and finally, a weak economy with poor results is 40% × 40%, or 16%. These four probabilities sum neatly to 100%, confirming that we’ve captured all possibilities.
With this tree in place, calculating the expected EPS is just a matter of taking the weighted average across these outcomes:
(0.18×1.80)+(0.42×1.70)+(0.24×1.30)+(0.16×1.00)=1.51
So, the expected EPS for the company, given all these scenarios, is $1.51. This figure doesn’t come from a single prediction but from blending all the possible paths and their probabilities into one coherent number.
Why Conditional Expectations Matter
A conditional expectation is just an expected value given that some event has occurred (i.e., after you learn new information). In the tree, that means you move to the What happens when new information arrives? Suppose we suddenly learn about a new tariff on steel imports. That information might change the likelihood of certain outcomes, such as how a domestic steel producer performs in a weak economy.
This is where conditional expectations come into play. Instead of averaging across all possibilities, we focus only on the branches consistent with the new information. In other words, if we know the tariff has been imposed, we condition on that event and recompute expectations. This ability to adapt to fresh data makes probability trees more than just static pictures—they become dynamic decision tools.
Bayes’ Formula: Updating Probabilities with New Information
While conditional expectations tell us how to adjust outcomes once we know which branch we’re on, Bayes’ formula goes deeper. It helps us revise the probability of events themselves in light of new information.
What is Bayes’ Formula and Why is it Used?
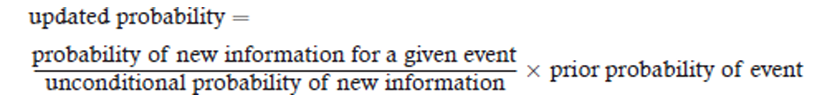
Bayes’ formula is a mathematical rule used to update the probability of an event when new information becomes available. It combines prior beliefs with fresh evidence to produce a revised, or posterior, probability. In investing, it is used to adjust forecasts—such as the likelihood of a stock outperforming—when new data like earnings reports, policy changes, or market news arrive.
Here’s the intuition: before receiving any new data, you have a prior belief about the probability of an event. Once you observe fresh evidence, Bayes’ formula lets you update that prior into a posterior probability, blending the old belief with the strength of the new evidence.
The formula is written as:
Example of Bayes’ Formula in an Investment Setting
Let’s connect this to investing. Suppose event A is that a stock will outperform, and event Aᶜ (read as “A complement”) is that the stock will underperform. Now imagine you receive a new piece of information, such as positive earnings news (B).
- P(A): your prior belief that the stock will outperform.
- P(B∣A): the probability of receiving positive news given that the stock outperforms.
- P(B): the overall probability of receiving positive news, regardless of performance.
Bayes’ formula tells us the updated probability that the stock will outperform given the new information:
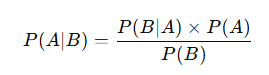
In words: if positive news arrives, you increase your confidence in the stock outperforming. The more likely positive news is under outperformance (relative to underperformance), the stronger your updated belief.
Imagine you are analyzing a tech stock. Your initial belief is that there’s a 40% chance the stock will outperform the market (Event A) and a 60% chance it will underperform (Event Aᶜ).
Now, earnings season arrives. You observe positive earnings news (Event B), and you want to update your belief: given this news, how likely is the stock to actually outperform?
Step 1: Define the probabilities
- Prior probability of outperforming (P(A)) = 0.40
- Prior probability of underperforming (P(Aᶜ)) = 0.60
Now, consider how likely positive earnings news is under each scenario:
- If the stock is truly an outperformer, the probability of positive news is high: P(B|A) = 0.70.
- If the stock is actually an underperformer, the probability of still seeing positive news is lower: P(B|Aᶜ) = 0.20.
Step 2: Compute the unconditional probability of positive news
Using the total probability rule
P(B) = P(B|A) × P(A) + P(B|Aᶜ) × P(Aᶜ)
P(B) = (0.70 × 0.40) + (0.20 × 0.60)
P(B) = 0.28 + 0.12 = 0.40
So, overall, there’s a 40% chance of hearing positive news.
Step 3: Apply Bayes’ formula
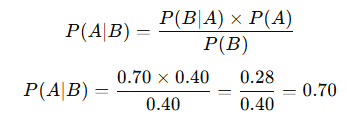
Step 4: Interpret the result
Before the news, you thought the stock had a 40% chance of outperforming. After hearing positive earnings news, your updated belief jumps to 70%.
This is Bayes’ formula in action: new evidence has dramatically increased your confidence in the stock.
Final Thought
Investing is not about predicting a single future but about preparing for many possible ones. Probability trees give us a clear way to map out these futures, quantify the likelihood of each, and calculate expected outcomes, such as the $1.51 EPS in our example.
Conditional expectations help us zoom in when new information narrows the possibilities, while Bayes’ formula equips us to go one step further—revising the very probabilities themselves when fresh evidence arrives. Together, these tools transform uncertainty into structured insight, allowing investors to make smarter, more adaptive decisions in a constantly changing market.


