

I will discuss the entire theory of EBIT-EPS break-even in this detailed blog. Having read through the entire blog, you can know how to work out the EBIT-EPS break-even analysis and its decision criteria.
What is EBIT-EPS Analysis, and what is its goal?
EBIT-EPS Analysis is a business tool to compare the various methods of financing the operations of the business (such as using debt or issuing shares) and how this impacts the earnings per share (EPS) of the company.
Using this financial indicator, we are able to determine whether to use borrowed capital or new shares.
This aims to determine the point at which the EPS will be equal, regardless of the financing method employed. This is known as the break-even point, and at this point, the earnings before interest and taxes (EBIT) is at a certain level that causes the earnings to be the same EPS at two or more financing methods.
Let’s break down the concept of EBIT-EPS Break-Even Analysis with a simple story to make it more relatable.
Scenario: “Green Power Tech Expansion”
Green Power Tech is a company that manufactures eco-friendly solar panels. The company wants to expand its operations and needs $100,000 to do so.
They have two options:
- Alternative 1: Fund 100% of the expansion through equity, meaning Green Power Tech will raise the entire $100,000 by issuing new shares.
- Alternative 2: Fund 50% of the expansion through debt at an interest rate of 10%, and the other 50% through equity.
- Tax Rate: 50%
- Share Value: $100 per share
Breakdown of the Two Alternatives:
Alternative 1: 100% Equity
- Green Power Tech will raise the entire $100,000 by issuing 1,000 new shares (100,000 / 100 per share).
- There is no interest payment in this case because they are not borrowing money.
Alternative 2: 50% Debt, 50% Equity
- The company will borrow $50,000 at 10% interest, so they will have to pay 5,000 dollars in annual interest.
- They will raise the other $50,000 through equity, issuing 500 new shares (50,000/100 per share).
The management team is trying to figure out which option will provide the best return for shareholders, so they decided to use EBIT-EPS Break Even Analysis to compare the impact of these two financing options on the company’s earnings per share (EPS).
Learning the Key Concepts
- EBIT (Earnings Before Interest and Taxes): It is the amount of money that a company earns before making any interest on loans or paying any taxes. The reason is that it is the operating income of the core business.
- EPS (Earnings Per Share): This is the amount of profit earned by the shareholders. Higher earnings made by the company would result in higher EPS. But when the number of shareholders increases (because of the issue of new shares), the profit is shared among more individuals, hence the EPS is low.
- Break-Even Point: The break-even point in EBIT-EPS analysis is the point where EBIT is the same using both financing sources and EPS is equal. Below this level, one choice may be superior to the other, which will depend on the impact of interest payments on the profits (in the case of debt) or the additional share issue on the profits (in the case of equity).
EBIT-EPS Break-Even Analysis Formula:
Now, let’s calculate the EBIT-EPS Break-Even Analysis. The formula for EBIT-EPS Break-Even Analysis is:

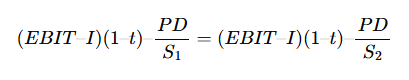
Where:
- EBIT = Earnings before interest and taxes.
- I = Interest on debt.
- t = Tax rate.
- PD = Preferred dividends (if any).
- S1 = Number of shares after issuing new equity.
- S2 = Number of shares without issuing new equity
Let’s start calculating the EBIT-EPS break-even analysis:
Step 1: Define the Variables
- Tax rate (t) = 50% = 0.50
- Interest (I) = $5,000 (for Alternative 2)
- Number of shares in Alternative 1 (S1) = 1,000 shares
- Number of shares in Alternative 2 (S2) = 50% equity = 500
Now, the company uses this formula to calculate the break-even EBIT. Let’s say the break-even EBIT comes out to $10,000
This $10,000 came out after calculating the EBIT-EPS break-even analysis, representing the level of profit (EBIT) where both financing options—borrowing money (debt) or issuing new shares (equity)—will result in the same earnings per share (EPS) for shareholders. It’s the point where either financing choice would have an equal impact on shareholder returns.
Proving the calculation of the EBIT-EPS break-even analysis
Alternative 1: 100% Equity
- EBIT (Earnings Before Interest and Taxes): $10,000.
- Since there is no debt in this option, there are no interest expenses.
- EBT (Earnings Before Taxes) is the same as EBIT: $10,000.
- Applying the tax rate of 50%, the tax is $5,000.
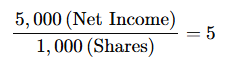
- Net Income (profit after taxes) is $5,000.
EPS Calculation: Since Green Power Tech has issued 1,000 shares, the Earnings Per Share (EPS) is calculated as:

Alternative 2: 50% Debt, 50% Equity
- EBIT (Earnings Before Interest and Taxes): $10,000.
- In this option, the company took on $50,000 in debt at 10% interest, so the interest expense is $5,000.
- EBT (Earnings Before Taxes) is now lower because of the interest payments: 10,000 (EBIT) – 5,000 (Interest) = 5,000.
- Applying the tax rate of 50%, the tax is $2,500.
- Net Income (profit after taxes) is $2,500.
EPS Calculation: In Alternative 2, 500 new shares were issued, making the total number of shares 500. The EPS is calculated as:
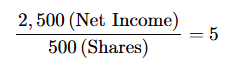
So, the EPS for Alternative 2 is also $5 per share.
Interpretation
- At $10,000 EBIT, the Earnings Per Share (EPS) is the same ($5 per share) in both financing options.
- This implies that the break-even point of these two financing options is 10,000 EBIT. At this level of profit, Green Power Tech would not make a difference to decide on 100 percent equity or 50 percent debt/50 percent equity; this will lead to the same EPS.
Decision Criteria
- If EBIT were higher than $10,000, the debt option (Alternative 2) would likely provide a higher EPS because interest payments are fixed, meaning more of the additional profit goes to shareholders.
- If EBIT were lower than $10,000, the equity option (Alternative 1) would be better because the company wouldn’t have to worry about interest payments eating into profits, and the EPS wouldn’t fall as much.
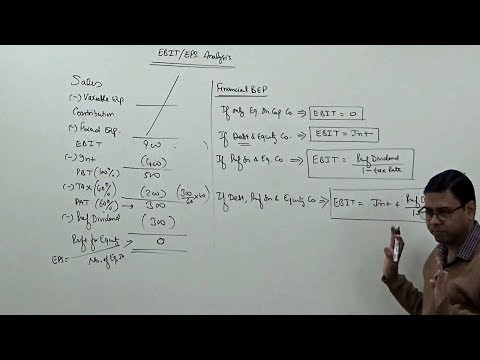
Watch a video on the topic of EBIT-EPS Break-Even Analysis
Conclusion: Why Does This Matter?
The EBIT-EPS Break-Even Analysis helps Green Power Tech make an informed decision based on its expectations for future earnings. It indicates when each financing option would be more advantageous to the shareholders in the form of earnings per share. This type of analysis is crucial because choosing the wrong financing option can result in lower returns for shareholders or unnecessary financial strain on the company.
Knowing this break-even point, companies such as Green Power Tech can make the financial decisions that match their growth forecast as well as their financial well-being and in the process, maximize shareholder value and reduce risks.
In case you would like to know further or you are still perplexed about the subject, let me know in the comment box.