

Evaluating an income statement might sound like an intimidating task at first, but don’t worry—it’s simpler than you think! Let’s break it down step by step on how to evaluate income statement by using a real-life example from Allied Food Products to make it easier to understand.
Table of Contents
- What Is an Income Statement?
- Breaking Down the Income Statement
- How an income statement is typically structured:
- Per-Share Data
- Key Takeaways from Allied’s Income Statement
- Conclusion
By the end of this guide, you’ll know exactly how to read and analyze an income statement to assess a company’s financial performance.
What Is an Income Statement?
An income statement, also known as a profit and loss statement, tells the story of a company’s financial performance over a specific period—monthly, quarterly, or annually. It highlights the company’s revenues, expenses, and profits, giving investors and managers insights into its ability to generate earnings.
Think of it as a report card for a company’s financial health. Unlike a balance sheet (which shows the company’s position at a specific point in time), the income statement shows how well the company performed over time.
Breaking Down the Income Statement
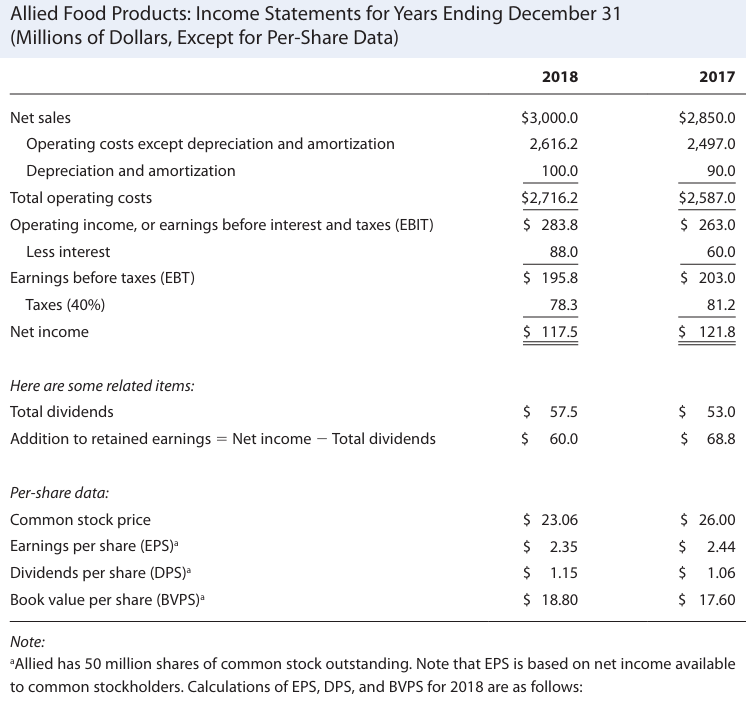
To explain the income statement we have used income statement examples for Allied’s 2017 and 2018
How an income statement is typically structured:
1. Net Sales (or Revenue)
This is where it all begins— the net sales of a company indicate how much money the company makes from selling its products or services. It’s the total revenue before subtracting any expenses. For Allied Food Products:
- 2018: $3,000 million
- 2017: $2,850 million
An increasing net sales figure suggests growth in customer demand. Allied’s $150 million increase in 2018 shows that its sales strategy worked well!
2. Operating Costs
The operating costs of a company indicate the cost of running a business. Operating costs include all expenses related to producing and selling the company’s products or services.
Operating costs are divided into two main categories:
- a. Operating Costs (Excluding Depreciation and Amortization):
These include raw materials, labor, utilities, and other day-to-day expenses. For Allied:- 2018: $2,616.2 million
- 2017: $2,497.0 million
- b. Depreciation and Amortization:
These are non-cash expenses that reflect the “wear and tear” of assets (like machines) or the expiration of intangible assets (like patents). For Allied:- 2018: $100.0 million
- 2017: $90.0 million
If operating costs grow faster than sales, it could signal inefficiency. Allied’s increase in operating costs reflects growing business activity but is still in proportion to its sales growth.
3. Operating Income (EBIT)
The operating income or Earnings Before Interest and Tax (EBIT) is one of the most important figures on the income statement. EBIT tells you how much profit the company generated from its core operations, before accounting for interest and taxes.
Operating Income (EBIT) formula:
For Allied, EBIT is calculated as:
- 2018: $283.8 million
- 2017: $263.0 million
Earnings Before Interest and Tax (EBIT) excludes factors like debt and taxes, so it’s a good indicator of how efficiently the business operates. Allied’s EBIT increased by $20.8 million in 2018, showing operational improvement.
4. Interest Expense
Interest expense is the cost of borrowing money. If a company has loans or bonds, it pays interest on them, which gets deducted here. For Allied:
- 2018: $88.0 million
- 2017: $60.0 million
A higher interest expense can eat into profits. Allied’s interest expense increased significantly in 2018 because they took on more debt, which ultimately impacted their net income.
5. Earnings Before Taxes (EBT)
After deducting interest expenses from EBIT, we arrive at Earnings Before Taxes (EBT). EBT shows how much profit the company made before accounting for taxes. For Allied:
- 2018: $195.8 million
- 2017: $203.0 million
Earnings Before Taxes (EBT) reflects how profitable the company is after financing costs. Allied’s EBT decreased in 2018 due to higher interest payments, despite better operating performance.
6. Taxes
Companies are required to pay a portion of their earnings as taxes. For simplicity, Allied applies a 40% tax rate:
- 2018: $78.3 million
- 2017: $81.2 million
7. Net Income
Finally, we reach the most important number—Net Income, also called the bottom line. Net income in the income statement is the profit available to shareholders after deducting all expenses (operating costs, interest, and taxes). For Allied:
- 2018: $117.5 million
- 2017: $121.8 million
Net income is a direct measure of profitability. While Allied improved operationally, their net income declined due to higher interest payments.
These are the basic items we must analyze sequentially to evaluate the Income statement. Besides these items, there are also many factors we must analyze to report our investors.
Per-Share Data
Publicly traded companies break down net income into per-share metrics to show profitability on a per-share basis. Here’s what you should know:
1. Earnings Per Share (EPS)
What is Earnings Per Share(EPS)?
Earnings Per Share (EPS) measures how much profit a company makes for each share of its stock. It’s calculated by dividing the company’s net income by the total number of outstanding shares. EPS shows how profitable a company is on a per-share basis, helping investors evaluate its performance.
Earnings Per Share (EPS) formula:
For Allied
- 2018: $2.35
- 2017: $2.44
A decline in EPS, like Allied’s, can indicate lower profitability for shareholders, even if the company’s operations are improving.
2. Dividends Per Share (DPS)
What is Dividends Per Share (DPS)?
Dividends Per Share (DPS) shows how much cash a company pays to its shareholders for each share they own. It’s calculated by dividing the total dividends paid by the number of outstanding shares, giving investors an idea of the returns they earn from their shares.
Dividends Per Share (DPS) formula:
For Allied:
- 2018: $1.15
- 2017: $1.06
Higher DPS reflects confidence in future cash flows. Allied increased dividends in 2018 despite lower net income, signaling financial strength.
3. Book Value Per Share (BVPS)
Book Value Per Share (BVPS) tells you the value of a company’s assets available to shareholders for each share if the company was liquidated. It’s calculated by dividing the company’s total equity by the number of outstanding shares, showing the net worth per share.
Book Value Per Share (BVPS) formula:
For Allied:
- 2018: $18.80
- 2017: $17.60
Why It Matters: BVPS shows how much each share is worth if the company were liquidated. Allied’s rising BVPS reflects a growing equity base.
Key Takeaways from Allied’s Income Statement
- Sales Growth: Allied’s net sales increased, reflecting healthy demand.
- Cost Management: Operating costs grew in proportion to sales.
- Debt Impact: Higher interest expenses reduced net income.
- Shareholder Returns: Allied increased dividends and equity value, indicating strong financial health despite lower net income.
Conclusion
Evaluating an income statement is about connecting the dots between revenue, expenses, and profits to understand how a company makes money. By analyzing components like EBIT, interest expenses, and net income, you can assess a company’s operational efficiency, financial stability, and profitability.
Using Allied Food Products as an example, you now have a blueprint for interpreting any company’s income statement. So next time you come across one, you’ll know exactly where to look and what questions to ask.
Happy analyzing!
Relevant Articles:


