


The Term Structure Derivation of Credit Risk Model is a market-based approach used to estimate the probability that a borrower (such as a company issuing bonds) will default on their debt.
Unlike accounting-based models (like Altman’s Z-Score), this model relies on current market data, particularly the yield curves of corporate and Treasury (risk-free) bonds.
It is a progressive data-driven approach, which enables financial institutions and investors to measure credit risk in terms of interest rate differentials between risky and risk-free instruments.
The Basic Idea, Term Structure Derivation of Credit Risk Model
When investors lend money to the government, they earn a risk-free rate (for example, through Treasury bonds).
When they lend to corporations, they demand a higher rate to compensate for the risk of default — this extra yield is known as the credit spread.
So, the difference between:
- Corporate bond yield = risky rate
- Treasury bond yield = risk-free rate
…reveals what the market expects in terms of default risk.
The Core Concept
In case of the corporate bond and the Treasury bond of equal maturity, then we can use the yields of these two bonds to get the probability of the bond to be repaid (p) and therefore the probability of default happening (1 – p) as well.
The basic relationship is:
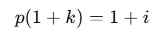
where:
- p = probability of repayment
- k = yield on the corporate bond
- i = yield on the Treasury (risk-free) bond
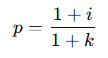
Rearranging:
Example (One-Year Bond)
Let’s assume:
- Risk-free Treasury yield (i) = 2.05%
- Corporate bond yield (k) = 7.80%
Then:
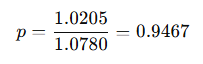
Probability of repayment = 94.67%
Probability of default = 1 – 0.9467 = 5.33%
This means the bond market expects a 5.33% chance that the borrower will default within one year.
Interpreting the Result
- A higher spread (k–i) indicates higher perceived default risk.
- A lower p (repayment probability) means the market believes the borrower is riskier.
Thus, yield spreads contain valuable information about credit quality.
Extending the Model to Multiple Years
Real-world loans and bonds often last several years, so we need to estimate default probabilities over multiple periods (e.g., 2 years, 3 years).
To do this, we use yield curves, which show how yields change with different maturities.
Step 1: Understand Marginal vs. Cumulative Default Probabilities
- Marginal Default Probability = chance of default in a specific year, given that no default happened before.
- Cumulative Default Probability = total chance of default within multiple years.
Formula:
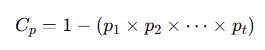
Example:
- p1= 0.95 (first-year survival = 95%)
- p2 = 0.93 (second-year survival = 93%)
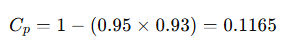
Cumulative default probability = 11.65%
Step 2: Using Yield Curves to Estimate Future Rates
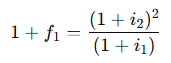
We now estimate future interest rates (called forward rates) using the term structure of Treasury and corporate yields.
For Treasury securities:
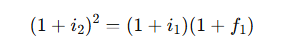
where:
- i1 = current 1-year Treasury yield
- i2 = current 2-year Treasury yield
- f1 = expected 1-year Treasury rate next year
Example:
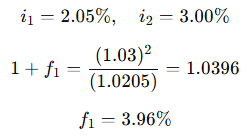
Expected Treasury 1-year rate next year = 3.96%
Step 3: Finding the Expected Corporate Rate (Next Year)
For corporate bonds:
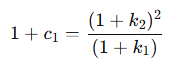
Example:
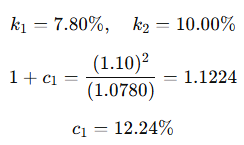
Expected 1-year corporate rate next year (Year 1 → 2) = 12.24%
Step 4: Estimating Probability of Repayment in Year 2
Now we compare the expected future Treasury and corporate rates:
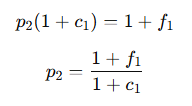
Example:
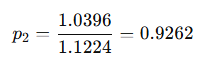
Probability of repayment in year 2 = 92.62%
Probability of default in year 2 = 7.38%
Step 5: Cumulative Default Probability (Two-Year Period)
Now combine both years:
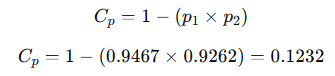
Cumulative default probability over two years = 12.32%
Summary Table
| Type | Current 1-Year Rate | Expected 1-Year Rate Next Year |
|---|---|---|
| Treasury (risk-free) | 2.05% | 3.96% |
| Corporate (B) | 7.80% | 12.24% |
| Spread | 5.75% | 8.28% |
As maturity increases, the credit spread widens — meaning investors demand more return for the added risk of long-term lending to risky borrowers.
Advantages of the Model
- Market-based – relies on real-time bond yields, not past data.
- Forward-looking – reflects current investor sentiment and expectations.
- Quantitative – allows measurable estimation of default probabilities.
- Useful for pricing risky loans and bonds.
Limitations
- Requires liquid markets for both Treasury and corporate zero-coupon bonds.
- Assumes market efficiency (that prices fully reflect risk).
May not be accurate for small or unrated firms (limited market data).
Doesn’t account for sudden economic shocks that can change risk rapidly.
Real-World Application
Financial institutions use this model to:
- Set credit spreads and loan interest rates.
- Estimate expected losses for risk management.
- Compare credit risk between borrowers.
- Derive default probabilities for pricing derivatives (like credit default swaps).
Conclusion
The Term Structure Derivation of Credit Risk Model transforms bond market data into actionable credit risk insights.
Comparing corporate and Treasury yield curves reveals how the market perceives a borrower’s ability to repay over time.
In essence, this model turns yield spreads into probabilities of default — offering a transparent, forward-looking tool for banks, investors, and analysts to make better lending and investment decisions.


